January 11, 2022

Stocks continued the big bounce today into technical support. 

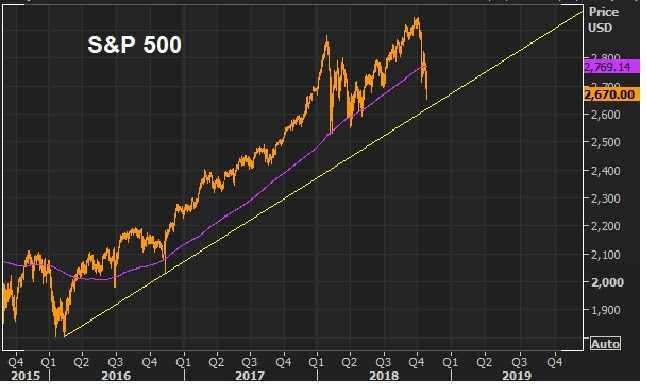
Let’s take an updated look at the S&P 500 chart …

So, we had a 5.5% decline in this benchmark index to start the year, and now we have a sharp bounce of nearly 3% from this big technical trendline, which comes in from the election day lows of November 2020 (an important marker).

We heard from Jay Powell today, in his renomination hearings before the Senate.  He did nothing to change the expectations on the Fed’s guidance on the rate path.  Whether it be three or four hikes this year, we’ve just finished a year with around 10% nominal growth and over 5% inflation.  

The coming year may be more of the same, and yet we have a market and Fed posturing and speculating over how close to 1% the Fed Funds rate might be by year end.  That dynamic only adds fuel to the inflation and growth fire.  

On that note, we’ve been watching three key spots that should be on the move with this policy outlook:  bonds (down), gold (up) and the dollar (down). 

Gold was up 1.25% today, making another run at this 1830-50 level.  If that level gives way, the move in gold should accelerate.  As you can see in the chart, we would get a breakout from this big corrective trend that comes down from the August 2020 all-time highs.     

On a related note (dollar down, commodities up), the dollar looks vulnerable to a breakdown technically …


March 28, 5:00 pm EST

Earlier this month, we talked about the big IPO agenda this year.

We have some big Silicon Valley “disrupters” set to go public this year, including Lyft, Uber, WeWork and Airbnb.

Lyft will IPO tomorrow.  The expectations is for a $20+ billion valuation.

The company has raised $4.9 billion in the private market since launching in 2012.   A little more than a year ago, it raised money at an $11 billion valuation.  If you were the investor at that stage, you’re looking at a double when it goes public (just 15-months later).

Now, if you are joe-average investor, as a buyer of Lyft shares, you’re about to pay these early private market investors at a $22 billion valuation.  This is a company that did about $2 billion in revenue last year, and lost about a billion dollars.

Remember, while the founders of these companies will become celebrated billionaires, the investors that buy these shares in the public market don’t tend to get rewarded very well.  Of course, there are exceptions, but remember, the IPOs this year are coming into a far less friendly regulatory environment than their “disrupter” predecessors of the past decade.

The reality:  The hyper-growth valuations are unlikely to get hyper-growth, as the regulatory advantages Silicon Valley has enjoyed over the past decade are now being scrutinized by Washington.

Here’s how the big “disrupters” of the past two years have fared, after much anticipated IPOs.

Dropbox:  Dropbox was priced at $21 per share.  It started trading at over $28.  Today it trades at $22.

Spotify:  Priced at $165.90 per share.  It started trading at $164.  It currently trades at $137.

Snap: Priced at $17 per share.  It started trading at $22.  Today it trades at $10.80.

After Lyft, Uber is on deck.  Uber last raised venture capital at a $68 billion valuation.  They are expected to go public at a $120 billion valuation.

Join me here to get my curated portfolio of 20 stocks that I think can do multiples of what broader stocks do, through the end of the year.

March 26, 5:00 pm EST

Yesterday we talked about the yield curve inversion.

It was driven by the Fed walking up the fed funds rate (i.e. “normalizing rates”) over the course of the past three years.  As we discussed yesterday, with global central banks pinning down the long-end of the yield curve through QE (now led by the BOJ), there were few things better telegraphed than the U.S. yield curve inversion.

The market is now pricing in a 66% chance of a rate cut by the end of the year.  The market is arguing that the rate hike the Fed made in December, was a mistake.

When have we seen this script before?  1995.  As we discussed coming into the year, 2018 was the first year since 1994 that cash was the best producing major asset class (among stocks, real estate, bonds, gold).  And the culprit was an overly aggressive Fed tightening cycle in a low inflation recovering economy.

The Fed ended up cutting rates in 1995 and spurring a huge run up in stocks (up 36%).  That’s the bet people are making again.  But I suspect we’ve already seen the equivalent of a cut through the Fed’s dovish posturing since early January.  Remember, they went on a media blitz the first several days of January, dialing down expectations that there would be any more tightening.

Join me here to get my curated portfolio of 20 stocks that I think can do multiples of what broader stocks do, through the end of the year.

March 25, 5:00 pm EST

There was a big technical break in the interest rate market on Friday.   And the yield curve inverted.

What does it mean, and should we be concerned?

First, when people talk about the yield curve, they are typically talking about the yield on the 3-month Treasury bill versus the yield on the 10-year government bond.  The latter should pay more, with the idea that money will cost more in the future (compensating for inflation and an “uncertainty about the future” premium).

When the 10-year is paying you less than you could earn holding a short term T-bill, the yield curve is said to be inverted.  And this dynamic has predicted the past seven recessions.  Why?  Because it typically will be driven by a tighter credit environment, namely banks become less enthused about borrowing in the form of short term loans, to lend that money out in longer term loans.  Money dries up. Unemployment goes up. Demand dries up. Economy dips.

With this in mind, today the 3-month treasury bill pays 2.44%. And the 10-year government bond pays 2.41%.  The spread is negative which makes for an inverted yield curve.

Now, while an inverted yield curve has preceded recessions with a good record, we’ve also had inverted yield curves and no recession has followed.

What isn’t talked about much, is why the yield curve is inverting this time.  It sort of spoils the drama to talk about the “why”.  Unlike any other time in history, we have an interest market that has been explicitly manipulated by global central banks for the past decade (via global QE).  And we have one major central bank (the Bank of Japan) remaining as a buyer of unlimited global assets (that includes U.S. 10 years, which pushes the 10-year yield lower).

Remember, the Bank of Japan’s policy of targeting their 10-year government bond yield at zero, means they will be a buyer of unlimited bonds to push JGB yields back toward zero (price goes up, yields go down).  And when the tide of global rates is rising, pulling UP their yields, they will be a buyer of whatever they need to, to push things back down (and they’ve done just that).

What does that mean?  It means, as the Fed has been walking its short-term benchmark rate higher, the “long-end” of the interest rate market (the 10-year yield) has been anchored by central bank buying – buying by all major central banks for the better part of a decade, and now led by the BOJ.  That has kept a lid on the U.S. 10-year government bond yield, and global government bond yields in general.

With this at work, there have been few things better telegraphed than a U.S. yield curve inversion, as the Fed has told us for years that they will march their short-term rate beyond the anchored 10-year yield.
It’s often dangerous to say “this time is different”, but I think it’s fair to say that the past yield curve inversion/recession analyses don’t compare, when you have both components (the front-end and the long-end) completely controlled by global central banks for more than a decade.  Join me here to get my curated portfolio of 20 stocks that I think can do multiples of what broader stocks do, through the end of the year.

March 20, 5:00 pm EST

The Fed met today and confirmed the signaling we’ve seen since early January.

With the luxury of solid growth, low unemployment and subdued inflation, they have been signaling to markets, since January, that they will do nothing to rock the boat.  That move has restored confidence and stock prices (a reinforcing loop).

So, the Fed has gone from mechanically raising rates (as recently as December) to sitting on their hands.  And today they are forecasting no further rate hikes this year, and they are ending the unwind of their balance sheet in September (ending quantitative tightening).

This all looks like a move to neutral, but given the rate path they had been telegraphing up until the end of last year, this pivot is effectively easing — especially since these moves look like pre-emptive strikes against the potential of Brexit and U.S./China trade negotiations going bad.

With that, we have a big technical break in the bond market today.  The U.S. 10-year government bond yield (chart below) broke this important trendline today.


This trendline represents the “normalization” of market rates following the Trump election.  Following the election, with the optimism surrounding Trumponomics, the market started pricing OUT the slow post-recession economic growth rut, and pricing IN the chance that we could see a return to sustained trend growth.

So, what is it pricing in now?  I would say its pricing in the worst-case scenario – a no deal with China.

Join me here to get my curated portfolio of 20 stocks that I think can do multiples of what broader stocks do, coming out of this market correction environment.

March 12, 5:00 pm EST

Remember, when oil prices began the fourth-quarter plunge from $76 down to as low as $42, we talked about the damage it would do to the inflation outlook, and how it may provoke a response from the Fed, which it has.

With today’s inflation data, you can see the impact of (yet another) oil price crash.  Headline inflation in the U.S. was running near 3% late last summer, the highest level since 2012. Now it’s 1.5%.


The Fed likes to talk about their assessment of inflation, excluding the effects of volatile oil prices. But they have a record of acting on monetary policy when oil is moving, especially in this post-crisis environment where deflation has been a persistent threat throughout.  They acted in 2016.  And they’ve acted in 2019.

Why?  They have the tools to deal with inflation.  They raise rates.  But the tools are limited to deal with deflation.  They cut rates.  But when rates hit zero, they have to get creative (like QE, negative rates, etc.).  And the consequences of losing the deflation battle are big.  When people hold onto their money thinking things will be cheaper tomorrow than they are today, that mindset can bring the economy to a dead halt. It’s a formula that can become irreversible.

So, we can see why the Fed has been pro-active in response to falling oil prices, falling stocks and falling inflation.  It can all lead to falling confidence.  And that can put them in the position of fighting the dangerous spiral of deflation.

That said, oil is on the rebound.  And as we discussed last month (here), with the quieting of controversy surrounding the Saudi government, it looks like a V-shaped recovery could be in store for oil prices (as we’ve seen with stocks).

Join me here to get my curated portfolio of 20 stocks that I think can do multiples of what broader stocks do, coming out of this market correction environment.

February 7, 5:00 pm EST

Downgrades on growth today weighed on global markets.

First, the European Commission slashed growth expectations for 2019 for all the major euro economies. For the EU overall, they are looking for 1.3% growth, versus 1.9% a few months ago.

Next up was the Bank of England decision on rates this morning.  They left rates unchanged, but downgraded growth for ’19 and ’20.  Keep in mind, this all incorporates the reset of expectations on global interest rates that have taken place over the past month (i.e. acommodative and staying that way).

So, why the downgrades? It’s all driven by fears of the worst case scenario on Brexit and U.S./China trade negotations.  That worst case scenario would be “no deal.”

Importantly, if we get these deals, the upgrades will come, quickly.

For the moment, though, we’re continuing to see an environment that looks much like 2016.  Central banks responded to the crash in oil prices by resetting expectations on monetary policy (easier).  And then the growth downgrades followed.

By the end of 2016, the U.S. election had swung sentiment from pessimism to optimism, and the growth upgrades came in — the Fed actually raised rates before the year-end.

I suspect if the fog of uncertainty clears, we will see the same.  But in the meantime, promoting the worst case scenario for growth may get policymakers in Europe motivated to follow the lead of the U.S. with some needed fiscal stimulus.  That would be good for European and global growth.


Join me here to get my curated portfolio of 20 stocks that I think can do multiples of what broader stocks do, coming out of this market correction environment.
.

February 6, 5:00 pm EST

Trump’s State of the Union address last night telegraphed the next priority in his economic plan:  Infrastructure.

Just two years in, this has become one of the final pillars of his Trumponomics plan, yet to be executed on.

Remember, when Trump took office he quickly went to work on reversing regulations that were stifling industries.  By the end of 2017, we got big tax cuts, which included incentives for companies to repatriate trillions of dollars of money held offshore.  And, of course, the fight for “fair trade” is ongoing, and maybe close to a resolution.

With these pro-growth policies, we have an economy that has finally escaped the decade-long rut of sub-2% growth.  We’ve returned to long-term trend growth (3%+).

So things look good, but we’ve yet to get the big kicker of an infrastructure spend. This is where we could see a real economic boom kick in.

And a split Congress is thought to be supportive of an infrastructure plan.  We’ve heard the Trump plan, which is $1.5 trillion funded through a private/public partnership.  After the Democrats won the house they said infrastructure would be high on the party’s agenda.  Back in March, the Democratic Senators proposed a $1 trillion plan.

If we get it, a big infrastructure spend could finally give us the big bounce back we typically see after a recession (i.e. some very big numbers).

Remember, the recovery of the past decade was manufactured by central banks.  The monetary stimulus and central bank intervention was good enough to keep the patient alive, but not to restore the global economy back to sustained, trend-growth. So we needed fiscal stimulus.  And we’ve gotten it.  But we’ve yet to see the type of big bounce back in growth typical of a post-recession recovery.

For context, in the left column of the table below, you can see the GDP numbers following the Great Depression.  And on the right, you can see the growth of the post-Great Recession (pre-Trump).

FBP_122717.jpg


Join me here to get my curated portfolio of 20 stocks that I think can do multiples of what broader stocks do, coming out of this market correction environment.

January 9, 5:00 pm EST

We discussed yesterday how markets might look by the end of the year, if the pontifications about a global slowdown and impending crisis are dead wrong.

The reality: That is the low probability outcome.  The higher probability outcome is another 3%+ year growth in the U.S. in 2019, a resolution on the Chinese trade dispute, and a rebound in emerging market growth.

With the “high probability scenario” in mind, let’s take a look at some key charts that look very vulnerable to a sharp squeeze.

Remember, oil and stocks have been in a synchronized decline since October 3.

On Friday we looked at this chart on oil, and the break of the big downtrend that accompanied some rate-hike relief jawboning from the Fed.

Today the chart looks like this …up almost 9% from Friday.
Here’s the chart on stocks we looked at on Friday …

We broke a big level on Friday at 2,520.  We’re up another 2.3% since.

What about yields?  The fear in the interest rate market hasn’t been/wasn’t that the economy can’t withstand a 3% ten-year yield.  The fear has been the speed at which the interest rate market was moving, and the methodical tightening process of the Fed.  Would 3% quickly become 4%?

The Fed has now backed off.  That quells the fears of a “too far, too fast” adjustment in rates.  But the interest rate market had already been pricing in the worst case scenario (another recession and crisis, in part thanks to the Fed policy).  If that was an over-reaction, I suspect we’ll see a move back toward 3%-3.25% in the 10s in the coming months. As you can see in the chart, this big line is being tested today.  And as long as the Fed stays data dependent, not telegraphing another series of hikes, the market should accept a 3% ten year yield just fine.  

To sum up: Markets tend to be caught wrong-footed at the extremes — leaning too hard in one direction, with sentiment too depressed or too exuberant.  And I suspect we’ve seen that extreme in Q4.  Sentiment was deeply shaken by the sharp decline in stocks, and that spilled over into the outlook for global economic stability.

But as we discussed yesterday, we have a Q4 earnings season upon us that is set up for positive surprises (given the sharp downward adjustment in expectations).  And if Trump gives some ground to get a deal done with China, these key markets are set up for big and sharp recoveries.

Join me here to get my curated portfolio of 20 stocks that I think can do multiples of what broader stocks do, coming out of this market correction environment.

October 25, 5:00 pm EST

Yesterday we looked at this big trendline support in stocks (the yellow line).


We had a good bounce today, but experience tells me that we will make a run at that trendline, and things will look a little messy before we bottom.

We still have seven trading days before the mid-term elections.  A stock market in correction is not as easy to promote as one at record highs (as we had just earlier this month).  With that, I suspect there are plenty of interests (China among them) to keep the pressure on stocks in hopes of dividing U.S. Congress come November 6th.

When the dust clears from the elections, market folks will realize that stocks are incredibly cheap at 15 times next year’s earnings estimates, in an economy growing better than 3%.

On that note, we have our first look at third quarter GDP tomorrow.  The market is looking for 3.6% growth, which would give us 3.22% annualized growth averaged over the past four quarters. That would be the best growth since 2006.

If you need help with your shopping list of stocks to buy on this dip, join me in my Billionaire’s Portfolio. We follow the world’s bests billionaire investors into their favorite stocks.  Click here to learn more.