
|
|
|
January 14, 5:00 pm EST Meaningful fourth quarter earnings kick off this week with the big banks. We heard from Citigroup this morning. They beat on earnings but on lower than expected revenues. The stock finished UP over 4%. We get JPMorgan and Wells Fargo Q4 earnings tomorrow before the open. Bank of America and Goldman Sachs will report on Wednesday. Remember, the turning point for stocks in December started with a call-out to the major banks by the U.S. Treasury Secretary. Not surprisingly, the turn in stocks was led by the banks. |
 |
|
You can see the big reversal in this chart of the KBW bank index. The index is now up 16% since December 26th. With the above in mind, one of the best value investors of the past twenty years, Jeffrey Ubben, has thought the timing is finally right for major banks. He has said the U.S. banking system has the lowest risk profile “than any time in our investing lifetime.” In our Billionaire’s Portfolio, we followed him into Citigroup, the highest conviction position in his $16 billion portfolio. It’s the cheapest of the four biggest U.S.-based global money center banks. As for earnings, overall: Remember, we’re coming off of three consecutive quarters of corporate earnings that blew away very lofty Wall Street estimates — 20%+ yoy earnings growth for the first three quarters of 2018. But sliding stocks in the fourth quarter eroded sentiment, and down came earnings estimates for Q4. The market is looking for just 10% earnings growth for the fourth quarter. For 2019, they’re looking for just 7%. This all sets up for positive surprises. Positive surprises are fuel for stocks.
Join me here to get my curated portfolio of 20 stocks that I think can do multiples of what broader stocks do, coming out of this market correction environment.
|
|
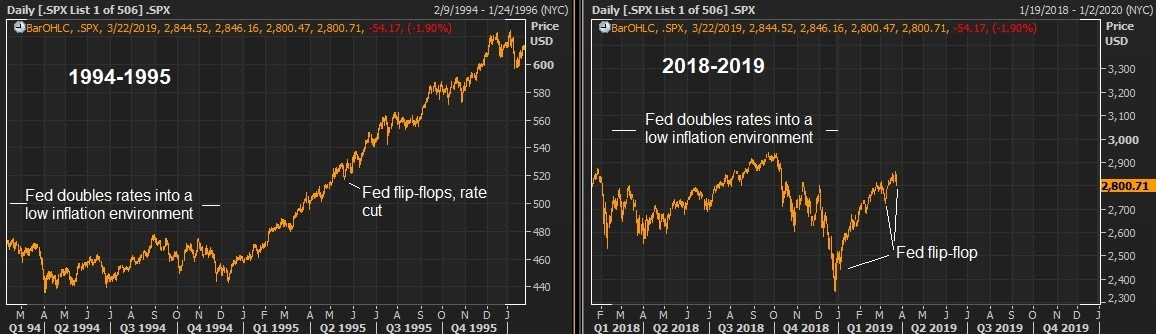
July 5, 5:00 pm EST I hope everyone had a great Fourth of July yesterday. Today, the markets continue to be thinly traded as we head into the jobs report tomorrow. We did get minutes from the recent Fed meeting today. This is a closer look into the views of the Fed from their June meeting. Of course, we already had a lot of information from that June meeting: the Fed hiked rates for the second time this year, they telegraphed an additional hike for the year in their projections, plus the June meeting was also accompanied by a press conference from Fed chair Jay Powell. And his explicit “main takeaway” was … “the economy is doing very well.” With this in mind, as we head into tomorrow’s jobs numbers, the 10-year yield is probably the most important chart to watch. While inflation isn’t near reflecting an economy that’s running hot, the interest rate market is even more disconnected. Remember, back on May 18, in my Pro Perspectives note, we discussed this chart …
|
 |
|
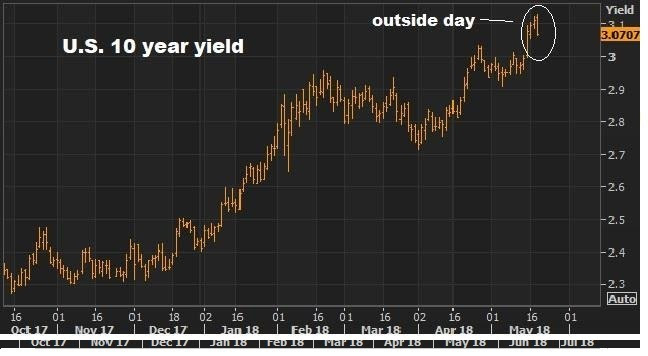
As the world was becoming concerned with the speed and level of market interest rates, we had this big technical reversal signal hit for the key 10-year government bond yield.
We focused on this in my May 18th piece, where I said “this technical phenomenon, when closing near the lows, is a very good predictor of tops and bottoms in markets, especially with long sustained trends.” And I said, “I suspect we may have seen some global central bank buyers of our Treasuries today (which puts downward pressure on yields) to take a bite out of the momentum.”
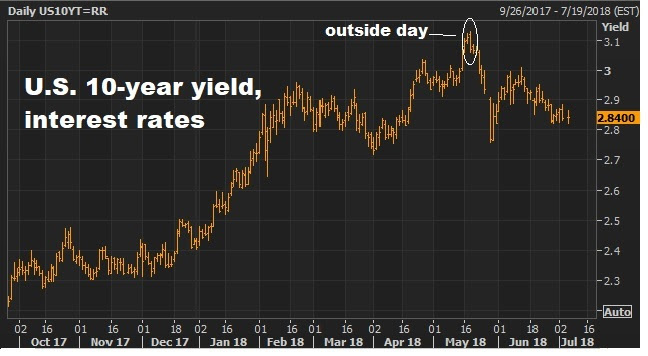
Today the chart looks like this … |
 |
|
So, that outside day did indeed predict a reversal. And we head into tomorrow’s job report with the benchmark 10-year yield at just 2.84%. That’s in a world where the economy is running at 3% growth and unemployment is under 4%.
But this disconnect may be changing tomorrow. The key data point tomorrow will be wages (Average Earning), not jobs. A hot number there will likely turn this around, and bring higher rates back into the picture.
If you haven’t joined the Billionaire’s Portfolio, where you can look over my shoulder and follow my hand selected 20-stock portfolio of the best billionaire owned and influenced stocks, you can join me here.
|
December 19, 4:00 pm EST
Remember, the Fed met last week and hiked rates for the third time this year, and the fifth time in the post-crisis hiking cycle. But as we discussed, the big event for interest rates wasn’t last week, it’s this week.
The Bank of Japan meets on Wednesday and Thursday. Japan‘s policy on pegging their 10-year yield at zero has been the anchor on global interest rates (weighing on global interest rates). When they signal a change to that policy, that’s when rates will finally move – and maybe very quickly.
With that in mind, we have the stock market continuing to climb north of +20% on the year. Economic growth is going to get very close to 3% for the full year of 2017, and yet the benchmark longer term interest rates determined by the market are unchanged for the year. The yield on the 10 year Treasury is 2.43% this morning (ticking UP today). We came into the year at 2.43%.
Again, this is the flattening yield curve we discussed last week. For a world that is constantly looking for the next potential danger or signal for doom, the flattening of the yield curve has been the latest place they’ve been hanging their hats (as what they believe to be a predictor of recession). But those people seem happy to assume this yield curve indicator is driven by the same behaviors that have led to recessions in past economic periods, ignoring the unprecedented and coordinated global central bank manipulation that has gotten us here and continues to warp the interest rate market.
So now we have the Fed, which has been moving away from emergency policies. The ECB has signaled an end to QE next year. And the Bank of Japan is next in line — it’s a matter of when.
So how do things look going into this week’s meeting? We know the architect of Japan’s economic reform plan, Prime Minister Shinzo Abe, has just followed the American fiscal stimulus movement with a corporate tax cut of his own, but only for companies that will start raising wages for their employees. He said today that Japan is no longer in a state of deflation. The head of the Bank of Japan has said the economy is in “very good shape.” And that they would consider what is the best level of rate targets to align with changes n the economy, prices and financial conditions. The recent Tankan survey showed sentiment in the manufacturing community hitting decade and multi-decade highs.
But inflation continues to undershoot in Japan, as it is in the U.S. Japan is targeting a 2% inflation rate and is running at just 0.8% annualized.
So it’s unlikely that they will give any signal of taking the foot off of the gas this week. But that signal is probably not far off — maybe in January, after U.S. tax cuts are in effect. What does that mean? It means our market rates probably make an aggressive move higher early next year (10s in the mid 3s and rates on consumer loans probably jump 150 to 200 basis points higher).
Join our Billionaire’s Portfolio today to get your portfolio in line with the most influential investors in the world, and hear more of my actionable political, economic and market analysis. Click her
December 14, 2:19 pm EST
The Fed decided to hike interest rates by another quarter point yesterday. That was fully telegraphed and anticipated by markets. That’s the third rate hike this year, and the fifth in the post-crisis rate hiking cycle.
Still, the yield on the 10-year Treasury note (the benchmark market determined interest rate), moved lower today, not higher — and sits unchanged for the year.
We talked earlier in the week about the biggest central bank event of the month. It wasn’t the Fed, but it will be in Japan next week. Japan’s policy on pegging their 10-year yield at zero has been the anchor on global interest rates.
When they signal a change to that policy, that’s when rates will finally move.
With this divergence between what the Fed is doing (setting rates) and what market rates are doing (market-determined), people have become convinced that the interest rate market is foretelling a recession coming — i.e. short term rates have been rising, while longer term rates have been quiet, if not falling. For example, when the Fed made it’s first rate hike in December of 2015, the 30-year government bond yield was 3%. Today, after five rate hikes on the overnight Fed determined interest rate, the 30-year is just 2.72% (lower, not higher than when the Fed started).
This dynamic has created a flattening yield curve. That gets people’s attention, because historically, when the yield curve has inverted (short term rates rise above long term rates), recession has followed every time since 1950, with one exception in the late 60s.
And it turns out, this “flattening of the yield curve” indicator, historically (and ultimate inversion, when it happens), is typically driven by monetary policy (i.e. rate hikes — check). In these cases, the market anticipates the Fed killing growth and eventually leading rate cuts! They find more certainty and stability in owning longer term bonds (leaving short term bonds pushing those rates up and moving into long term bonds, pushing those rates down — inverting the curve).
The question, is that the case this time? Or is this time different. It’s rarely a good idea in markets to think this time is different than the past. But in this case, following trillions of dollars of central bank intervention and a near implosion in the global economy, it’s probably safe to say that this time is certainly different than past recessions. Though the Fed is in a hiking cycle, rates remain well below long term averages. And, as we know, we have unconventional monetary policies at work in other key areas of the world — stoking liquidity, growth and skewing demand for U.S. Treasuries (which suppresses those long term interest rates).
So the flattening yield curve fears are probably misplaced, especially given big fiscal stimulus is coming. And when Japan moves off of its “zero yield policy,” the U.S. yield curve may steepen more quickly than people think is possible.
Join our Billionaire’s Portfolio today to get your portfolio in line with the most influential investors in the world, and hear more of my actionable political, economic and market analysis. Click her
September 19, 2017, 6:00 pm EST Invest Alongside Billionaires For $297/Qtr
 With a Fed decision queued up for tomorrow, let’s take a look at how the rates picture has evolved this year.
The Fed has continued to act like speculators, placing bets on the prospects of fiscal stimulus and hotter growth. And they’ve proven not to be very good.
Remember, they finally kicked off their rate “normalization” plan in December of 2015. With things relatively stable globally, the slow U.S. recovery still on path, and with U.S. stocks near the record highs, they pulled the trigger on a 25 basis point hike in late 2015. And they projected at that time to hike another four times over the coming year (2016).
Stocks proceeded to slide by 13% over the next month. Market interest rates (the 10 year yield) went down, not up, following the hike — and not by a little, but by a lot. The 10 year yield fell from 2.33% to 1.53% over the next two months. And by April, the Fed walked back on their big promises for a tightening campaign. And the messaging began turning dark. The Fed went from talking about four hikes in a year, to talking about the prospects of going to negative interest rates.
That was until the U.S. elections. Suddenly, the outlook for the global economy changed, with the idea that big fiscal stimulus could be coming. So without any data justification for changing gears (for an institution that constantly beats the drum of “data dependence”), the Fed went right back to its hawkish mantra/ tightening game plan.
With that, they hit the reset button in December, and went back to the old game plan. They hiked in December. They told us more were coming this year. And, so far, they’ve hiked in March and June.
Below is how the interest rate market has responded. Rates have gone lower after each hike. Just in the past couple of days have, however, we returned to levels (and slightly above) where we stood going into the June hike.

But if you believe in the growing prospects of policy execution, which we’ve been discussing, you have to think this behavior in market rates (going lower) are coming to an end (i.e. higher rates).
As I said, the Hurricanes represented a crisis that May Be The Turning Point For Trump. This was an opportunity for the President to show leadership in a time people were looking for leadership. And it was a chance for the public perception to begin to shift. And it did. The bottom was marked in Trump pessimism. And much needed policy execution has been kickstarted by the need for Congress to come together to get the debt ceiling raised and hurricane aid approved. And I suspect that Trump’s address to the U.N. today will add further support to this building momentum of sentiment turnaround for the administration. With this, I would expect to hear a hawkish Fed tomorrow.
Join our Billionaire’s Portfolio today to get your portfolio in line with the most influential investors in the world, and hear more of my actionable political, economic and market analysis. Click here to learn more.
February 22, 2017, 4:30pm EST Invest Alongside Billionaires For $297/Qtr
We had new record highs again in the Dow today. But remember, yesterday we talked about this dynamic where stocks, commodities and the dollar were strong. But a missing piece in the growing optimism about growth has been yields.
Clearly the 10 year at 2.40ish is far different than the pre-election levels of 1.75%-1.80%. But the extension was quick and has since been a non-participant in the full-on optimism vote given across other key markets.
Why? While stocks can get ahead of better growth, yields can’t in this environment. Higher stocks can actually feed higher growth. Higher yields, on the other hand, can kill it.
But there’s something else at work here. As we know Japan’s policy to target the their 10 year at zero provides an anchor to our interest rates, as the BOJ is in unlimited QE mode. Some of that freshly produced liquidity, and the money displaced by their bond buying, undoubtedly finds a happier home in U.S. Treasuries (with a rising dollar, and a 2.4% yield). That caps yields.
But in large part, the quiet drag on U.S. yields has also come from the rising risks in Europe. The election cycle in Europe continues to threaten a populist Trump-like movement, which is very negative for the European Union and for the survival of the single currency (the euro). That creates capital flight, which has been contributing to dollar strength and flows into the parking place of U.S. Treasuries (which pressures yields, which is keeping mortgage and other consumer rates in check).
These flows are also showing up clearly in the safest bond market in Europe: the German bunds. The 2-year German bund hit an all-time record LOW, today of -91 basis points. Yes, while the U.S. mindset is adjusting for the idea of a 3%-4% growth era, German yields are reflecting crisis and money is plowing into the safest parking place in Europe. The spread between German and French bonds are reflecting the mid-2012 levels when Italy and Spain where on the brink of insolvency — only to be saved by a bold threat/backstop from the European Central Bank.
We talked last week about the prospects for higher gold and lower yields as questions arise about the execution of (or speed of execution) Trump’s growth policies, some of the inflation optimism that has been priced in, may begin to soften. That would also lead to a breather for the stock market. I suspect we will begin to see the coming elections in Europe also contribute to some de-risking for the next couple of months. We already have a good earnings season and some solid economic data and optimism about the policy path priced in. May be time for a dip. But as I’ve said, it would create opportunities– to buy any dip in stocks, and sell any rally in bonds.
To peek inside the portfolio of Trump’s key advisor, join me in our Billionaire’s Portfolio. When you do, I’ll send you my special report with all of the details on Icahn, and where he’s investing his multibillion-dollar fortune to take advantage of Trump policies. Click here to join now.
February 15, 2017, 4:30pm EST Invest Alongside Billionaires For $297/Qtr
Stocks continue to make new highs – five consecutive days of higher highs in the Dow. The Trump administration continues to make new news. And the Fed continues to become less important. Those have been the themes of the week.
Today was the deadline for all big money managers to give a public snapshot of their portfolios to the SEC (as they stood at the end of Q4). So let’s review why (if at all) the news you read about today, regarding the moves of big investors, matters.
Remember, all investors that are managing over $100 million are required to publicly disclose their holdings every quarter. They have 45 days from the end of the quarter to file that disclosure with the SEC. It’s called a form 13F.
First, it’s important to understand that some of the moves deduced from 13F filings can be as old as 135 days. Filings must be made 45 days after the previous quarter ends.
Now, there are literally thousands of investment managers that are required to report on a 13F. That means there are thousands of filings. And the difference in manager talent, strategies, portfolio sizes, motivations and investment mandates runs the gamut.
Although the media loves to run splashy headlines about who bought what, and who sold what, to make you feel overconfident about what you own, scared about what they sold, anxious, envious or all a combination of it all. The truth is, most of the meaningful portfolio activity is already well known. Many times, if they are big stakes, they’ve already been reported in another filing with the SEC, called the 13D.
With this all in mind, there are nuggets to be found in 13Fs. Let’s revisit how to find them, and the take aways from the recent filings.
I only look at a tiny percentage of filings—just the investors that have long and proven track records, distinct approaches, and who have concentrated portfolios. That narrows the universe dramatically.
Here’s what to look for:
- Clustering in stocks and sectors by good hedge funds is bullish. Situations where good funds are doubling down on stocks is bullish. This all can provide good insight into the mindset of the biggest and best investors in the world, and can be a predictor of trends that have yet to materialize in the market’s eye.
- For specialist investors (such as a technology focused hedge fund) we take note when they buy a new technology stock or double down on a technology stock. This is much more predictive than when a generalist investor, as an example, buys a technology stock or takes a macro bet.
- The bigger the position relative to the size of their portfolio, the better. Concentrated positions show conviction. Conviction tends to result in a higher probability of success. Again, in most cases, we will see these first in the 13D filings.
- New positions that are of large, but under 5%, are worthy of putting on the watch list. These positions can be an indicator that the investor is building a position that will soon be a “controlling stake.”
- Trimming of positions is generally not predictive unless a hedge fund or billionaire cuts by a substantial amount, or cuts below 5% (which we will see first in 13D filings). Funds also tend to trim losers into the fourth quarter for tax loss benefits, and then they buy them back early the following year.
As for the takeaways from Q4 filings, the best names had built stakes in financials. That’s not surprising given that the Trump win had all but promised a “de-Dodd Franking” of the banking system, especially with the line-up of former Goldman alum that had been announced by late December.
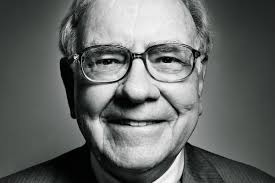
The other big notable in the filings: Warren Buffett’s stake in Apple.
Remember, as we headed into the Brexit vote last year, the broad market mood was shaky. Markets were recovering after the oil price crash, and the unknowns from Brexit had some running for cover. Meanwhile, some of the best investors were building as others were trimming. They were buying energy near the bottom. They were buying health care. And while many were selling the most dominant company in the world, Warren Buffett was buying from them. The guy who has made his fortunes buying when others are selling, did it again with Apple. He was buying near the bottom last summer, and in the fourth quarter he ramped up big time, more than tripling his stake to a $6.6 billion position.
Follow The Lead Of Great Investors Like Warren Buffett In Our Billionaire’s Portfolio
In our Billionaire’s Portfolio, we’re positioned in a portfolio of deep value stocks that all have the potential to do multiples of what broader stocks do — all stocks owned and influenced by the world’s smartest and most powerful billionaire investors. Join us today and follow the world’s best investors into their best stocks. Our portfolio was up over 27% in 2016. Click here to subscribe.
#stocks
January 17, 2017, 6:00pm EST

As we kick off inauguration week, we have a continuation of this “buy the rumor, sell the fact” trade going on in markets.
We often see this phenomenon–it’s a reflection of investors pricing new information in anticipation of an event, and then selling into the event on the notion that the market has already valued the new information. And as we discussed last week, it looks like we’ve already been working on this “sell the fact” phase. Stocks have stalled, the dollar has pulled back a bit and global interest rates have slid off of the post-election highs. But as I said, these retracements should be shallow and short-lived.
Why? Because we appear to finally be in an environment where optimism (not hope) is outweighing fear. Contrary to the narrative of skepticim coming from the media, the markets, the data and the players are all sending very positive signals on the policy outlook.
The media has warned about the dangers of Trump’s rhetoric. Meanwhile, those that have been most directly targeted haven’t become enemies, they’ve quickly become allies and advocates of the Trump administration, making concessions and buying into the growth outlook. We’ve seen it at the corporate level (from GM to Alibaba). And we’ll likely see it at the sovereign level. The threats of taxes and fines have leveraged jobs with U.S. corporates. Tariffs can leverage better trade deals in a world and time that everyone can greatly benefit from better U.S. growth, which can ultimately lead to better and more sustainable global growth.
On the data front, small business optimism is running at the highest level in 37 years. And, as we’re getting into the heart of earnings seasons, the positive surprises are already coming in bigger and at a hotter pace. That’s for the fourth quarter, with just a sliver of post-election certainty priced in.
Add to that, the most troubled industries through the post-financial crisis period have been energy and financials. Financials now have the tailwind of rising interest rates and an outlook for softer regulation. Energy companies have spent that past couple of years cutting costs and reducing debt in the oil price crash. With oil back above $50 and with good prospects to go higher as they ramp up production, they will become earnings machines. This is all fuel for hotter earnings and higher stocks.
Plus, on the earnings note, people are just beginning to wake up to the fact that a better growth environment and a dramatic cut in the corporate tax rate will pump up broad market earnings next year–perhaps as much as 15%-20% better than what’s already projected for 2017.
With all of this in mind, it’s unlikely that investors will retrench over the coming months and wait for proof that Trump promises will be kept and Trump policies will be executed well. Instead, following the swearing in of the new President on Friday, we’ll probably see the “reflation” rally resume.
For help building a high potential portfolio, follow me in our Billionaire’s Portfolio, where you look over my shoulder as I follow the world’s best investors into their best stocks. Our portfolio more than doubled the return of the S&P 500 in 2016. You can join me here and get positioned for a big 2017.