We had the jobs report this morning. As we discussed on Wednesday, the weak ADP report was telegraphing a “below expectations” government jobs report.
Indeed, that’s what we got this morning.
And, while a bad job number is typically seen as bad news for stocks, in a world where the Fed has been on the hot seat to deliver a rate cut, it increases the likelihood of that happening. A rate cut is fuel for stocks, and with that, stocks continued the very strong bounceback, closing near the highs of the week.
What problems would a rate cut solve? It would mostly improve sentiment. A yield curve inversion has been spooking markets now for a while (as it has a record of predicting recessions). Perhaps contrary to what some may think, a rate cut by the Fed should steepen the yield curve. It would not only lower the front end of the curve (shorter term rates), but likely increase longer term rates by improving sentiment (i.e. higher long-term rates on the optimism that the Fed isn’t going to kill the economy through overly-tight monetary policy).
Now, while stocks have continued with a very persistent march higher this week, gold has also marched higher, and the dollar has fallen, and rates have remained near dead lows. What’s going on?
Is it the threat of tariffs hitting Mexico on Monday? I don’t think so. Stocks have well recovered and surpassed the levels prior to Trump’s tweet that threatened Mexico.
There may be something bigger happening.
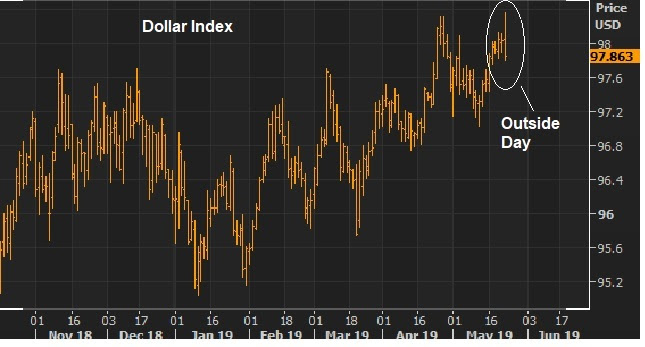
A couple of weeks ago, we looked at this technical reversal signal in the dollar (chart below) and talked about the prospects of the trade war with China ending in a grand and coordinated currency agreement. The dollar has since been on the move (lower).
What do I mean by a currency agreement? There are a lot of similarities between the U.S/China standoff and that of U.S. and Japan in the 1980s. That was ended with the “Plaza Accord” — an agreement between the U.S., Japan, Germany, England and France. The Plaza Accord was a plan to balance global trade, through a 50% depreciation of the dollar (vs. the yen and d-mark).
As I said a couple of weeks ago, we may wake up one day and find a similar agreement has been made between the U.S. and major global trading partners (which may include China, or not). It might be a deal between the U.S. and China to “revalue” the yuan (i.e. strengthen it). Or it may exclude China (just G3 economies). With the behavior in markets the past few days, it smells like something is cooking.
Stocks continue to bounce back today, driven by the signalling from global central banks that they will act, if economic activity deteriorates.
First we heard from Jerome Powell on Tuesday, the Fed Chair. He opened a prepared speech by saying they would “act as appropriate to sustain the economic expansion.” Today we heard from the second most powerful central banker in the world, ECB President Mario Draghi. He echoed the sentiment of the Fed, acknowledging the global trade war risks, and said they were prepared to act, if needed.
What does “acting” mean? It would mean cutting rates by the Fed. It would mean restarting QE at the ECB.
For now, it’s all an effort to verbally massage market sentiment. And it’s working, at least for the moment.
Add to this, we had some positive news on U.S./Mexico negotiations.
With that, let’s look at some key charts …
First, here’s a look at the S&P 500 …
We’ve had an 8% decline in stocks from the April 30 highs. And now we the break of the downtrend on the rebound of the past few days. And we’re back above the 200-day moving average (the purple line).
What about oil? As we discussed, the magic number in oil is $50. That’s the breakeven point for the shale industry, below which, they can not profitably produce.
After sniffing toward that $50 level yesterday, we had a big bounce today — almost 6% higher than yesterday’s low.
And finally, here’s a look at interest rates. This has been the most concerning market, as it has completely come unhinged from the current economic conditions — pricing in the worst case scenario for geopolitical tensions. But rates are showing some life today.
For technicians, as you can see in the charts above, we’ve traded into the 61.8% Fibonacci retracement in both oil and rates.
With technical support holding in these key markets, combined with the break of the downtrend in stocks, the worst of the market pain may be behind us (i.e. a recovery underway).
If you haven’t signed up for my Billionaire’s Portfolio, don’t delay … we’ve just had another big exit in our portfolio, and we’ve replaced it with the favorite stock of the most revered investor in corporate America — it’s a stock with double potential.
Join now and get your risk free access by signing up here.
It’s jobs week. We’ll get the May jobs report on Friday.
As we’ve been discussing, the market is on Fed watch, looking for a rate cut from the Fed. And as the Fed says, they are closely watching the data for signs of deterioration in the economy.
On that note, there are few data points more scrutinized than the jobs data.
This morning we had a glimpse of what the Friday report might look like. The May ADP jobs report today showed just 27k jobs added. That was a huge miss. The expectation was 180k. The government report due on Friday is expected to show 185k new jobs. If that number comes in much lower (i.e. slower job creation), is that enough to prompt a June rate cut?
Maybe.
Equally, if not more important to the Fed, is the sharp decline that continues in crude oil. As I said last week, there are two clear influences on Fed policy over the past few years. Stocks and crude oil.
As for oil prices, the Fed has a history of acting when prices move sharply lower. Low oil prices weigh on inflation, and inflation is already running at very soft levels.
Why is that a bad thing? Inflation that’s too weak, can threaten deflation. They have the tools to deal with inflation. They raise rates. But the tools are limited to deal with deflation. They cut rates. But when rates hit zero, they have to get creative (like QE, negative rates, etc.). And the consequences of losing the deflation battle are big. When people hold onto their money thinking things will be cheaper tomorrow than they are today, that mindset can bring the economy to a dead halt. It’s a formula that can become irreversible.
Adding to the deflation threat, there is a global financial stability threat that comes from low oil prices. As we found in 2016, when oil prices crashed, the shale industry is very vulnerable. Defaults started lining up in the industry, which makes banks vulnerable. When banks are vulnerable, credit tends to tighten and the financial system can quickly become unstable.
So, what is the magic number for oil? $50. A recent Dallas Fed survey has the breakeven level for shale producers at $50. Crude traded as low as $50.60 today.
If you haven’t signed up for my Billionaire’s Portfolio, don’t delay … we’ve just had another big exit in our portfolio, and we’ve replaced it with the favorite stock of the most revered investor in corporate America — it’s a stock with double potential.
Join now and get your risk free access by signing up here.
We’ve talked about the build up to a Fed rate cut. On that note, we heard from the Fed Chair this morning (more in a moment).
As we’ve discussed, the market has been bullying the Fed for a rate cut, with a 10- year yield sitting near the lowest levels since late 2017 – almost 120 basis points lower than the levels of just six months ago.
Here’s what that looks like on a chart …
For perspective, the last time the U.S. 10-year government bond yield (the benchmark “market determined” interest rate) was here, the Fed determined benchmark interest rate was only 1.25%. The Fed is now at 2.50%.
Is the Fed listening to the message from the interest rate market? The good news: It seems so.
We’ve heard from Fed officials (yesterday and today), acknowledging that they (the Fed) have the flexibility (with low and tame inflation) to cut rates as an insurance policy against an economic slowdown.
The Fed Chair himself said as much this morning in prepared remarks for his scheduled speech at a Chicago Fed conference. Here’s what he said…
“I’d like first to say a word about recent developments involving trade negotiations and other matters. We do not know how or when these issues will be resolved. We are closely monitoring the implications of these developments for the U.S. economic outlook and, as always, we will act as appropriate to sustain the expansion…”
So, we had a tone-deaf Fed in December, hiking rates into falling stock markets and growing global economic risks. And now it appears the Fed is hearing more clearly.
With that, we get a big bounce back in stocks over the past 24-hours. And, importantly, the S&P 500 has recovered back above the 200-day moving average (the purple line).
And, as you can see in the chart of 10-year yields above, we’re also getting big technical support at the lows yesterday in interest rates. Both charts support the scenario of recovery/bounce.
If you haven’t signed up for my Billionaire’s Portfolio, don’t delay … we’ve just had another big exit in our portfolio, and we’ve replaced it with the favorite stock of the most revered investor in corporate America — it’s a stock with double potential.
Join now and get your risk free access by signing up here.
Back on December 19th, the Fed hiked rates into a sharply falling stock market. This turned out be the last rate hike in its “rate normalization program.”
Here’s an excerpt from my ProPerspectives note from December 19th, following the Fed meeting:
“This sets up for what looks like an ugly finish for the year. Remember, as we discussed on Monday, we talked about the similarities to 1994. The Fed, back in 1994, was alsosystematically raising interest rates into a low inflation, recovering economy — in anticipation that inflation would quicken. It didn’t happen. They ended up choking off growth.
This is the first time since 1994 that stocks, bonds, real estate and gold have all been losers on the year (negative returns). And the first time cash has been the highest return asset class. As we discussed,the Fed had to reverse course and cut rates in 1995, which finally unleashed the stock market, which finished up 36% that year.
Bottom line: The Fed has been, by their own admission, walking a tightrope trying to raise rates without killing the recovery. They now clearly have signals, in the plunge in stocks and oil prices, that they may have gone too far.“
Fast forward to today, and the markets have clearly signaled that the Fed made a mistake (at least) with the last rate hike.
With that, the rate cut chatter is now loud. The interest rate market is pricing in a 60% chance of a cut at the July meeting. And we’re now hearing more and more aggressive projections for where the Fed will take rates by year end. Barclay’s thinks they will cut three times this year. That’s anticipating a lot of economic deterioration.
Still, with that extreme viewpoint out there, the market is still underpricing the chance of a rate cut this month — at the Fed’s June meeting on the 19th. That sets up for a surprise.
And we may get some signals tomorrow, as Jerome Powell is scheduled for a prepared speech at a Chicago Fed conference (9:55 EST). Interestingly, the conference is called “Fed Listens.” Let’s see how well they are listening to markets.
It’s not uncommon for the Fed to float some policys shift balloons. We saw plenty of it in January, when they went on a public campaign to make clear to markets that they were done with interest rates hikes. They have since moved to a neutral stance. Today we Jim Bullard — St. Louis Fed President, a voting member — say a cut may be “warranted soon” to “provide some insurance” in case of a sharper slowdown.
The 10-year yield seems to keep bleeding lower, forcing the Fed’s hand. The 10-year yield is now 43 basis points below the top end of the Fed Funds target range (2.25 to 2.50%).
If you haven’t signed up for my Billionaire’s Portfolio, don’t delay … we’ve just had another big exit in our portfolio, and we’ve replaced it with the favorite stock of the most revered investor in corporate America — it’s a stock with double potential.
Join now and get your risk free access by signing up here.
We end the month of May today. Things were going quite well for markets, with stocks sitting on record highs, until Trump did this over the first weekend of the month …
With the above in mind, let’s look back at my May 6th note: “Why would Trump risk complicating a deal, even more, by threatening China with a deadline/tariff increase? Because he has leverage. He has a stock market near record highs, and a strong economy and the winds of ultra-easy global monetary policy at his back …
So, Trump has a win–win going into the week. If the threat works, he gets a deal done, and likely gives less to get it done. If China backs off, stocks go down, and he gets the Fed’s ratecut he’s been looking for–stocks go back up.”
As we know, China walked. And Trump is now using a similar position of strength to influence policy with Mexico. As such, stocks have now fallen nearly 7% from the highs. And the prospects for a Fed rate cut are looking very strong.
How strong? The interest rate market is pricing in a 90% chance of a rate cut by year end, and a 60% chance of a two rate cuts. But despite the sharp decline in global interest rates, the market seems to be well underestimating the chances for a Fed rate cut this month — at the June 19 Fed meeting.
There are two clear influences on Fed policy over the past few years. Stocks and crude oil. The latter weighs on inflation. While the Fed claims to ignore the influence of food and energy in their inflation measure, they have a history of acting when oil moves sharply. And inflation is already running at very soft levels. On that note, what was the biggest loser for the day, week and month? Crude oil. Crude was down 7.5% today, 10% for the week, and 16% for the month.
If you haven’t signed up for my Billionaire’s Portfolio, don’t delay … we’ve just had another big exit in our portfolio, and we’ve replaced it with the favorite stock of the most revered investor in corporate America — it’s a stock with double potential.
Join now and get your risk free access by signing up here.
The first revision of Q1 GDP came in this morning, in-line with expectations (at 3.1%). As yields swoon, and stocks have given back some gains for the month, this growth number today is good reminder that the state of the U.S. economy is good.
Remember, back in April, the first look at Q1 GDP came in as a huge positive surprise (at 3.2%). Many were expecting it to be a terrible quarter. Goldman Sachs thought the quarter would produce just 0.7% growth. They were wrong, and they weren’t alone. At the end of the first quarter, the Atlanta Fed’s GDP model was estimating that the economy grew at only 0.3% in Q1.
With that in mind, don’t get too caught up in the souring growth story. At the moment, the consensus view on Wall Street is for Q2 growth to come in at 1.8%. And the Atlanta Fed model is looking for 1.3%. Both are well lower than the White House envisioned 3%+ growth trend.
But, for perspective, there are some clear factors working in favor of the higher (not lower) growth case.
The job market is strong. We have monthly new jobs running at a 12-month average of 218k. That’s well above pre-financial crisis average monthly job growth. The unemployment number at 3.6% is the lowest since 1969.
Most importantly: Wage growth has been on the move for the past 18 months, now sustaining above 3%. And Q1 productivity came in at 3.6%, the hottest productivity reading in almost a decade. The economy can grow by expanding the size of the workforce or the productivity of the workforce. We’re finally getting solid productivity growth.
We’ve talked about the signal the interest rate market is giving: with rates at these levels, the bond market may force the Fed’s hand — forcing a June rate cut.
Still, the slide in the 10-year yield from 2.75 (in March) to 2.20 (the low today) is well overstating the risks in the global economy. That’s more than 100 basis points off of the highs of just six months ago. And the high to low of the last five trading days has been almost a full quarter point (23 basis points). It makes no sense.
Many would assume it’s related due to the trade standstill. But the IMF has only cut its growth estimate by 3/10ths of a percent from the tariff escalations. That still projects a 3% growth from the global economy (much better than the average of the past 10-years).
Meanwhile, a U.S. 10-year and 2.20%, and German and Japanese yields well in negative territory are pricing in global recession (if not worse). Is Japan buying U.S. Treasuries, and therefore pushing down global yields? Maybe.
As we know, the slide in yields has weighed on confidence, and therefore stocks for the month of May. But today, we ran into a huge technical level in the S&P 500 — the 200-day moving average. And we had a big bounce. I suspect we’ve seen the bottom of this move in stocks and yields. We shall see.
If you haven’t signed up for my Billionaire’s Portfolio, don’t delay … we’ve just had another big exit in our portfolio, and we’ve replaced it with the favorite stock of the most revered investor in corporate America — it’s a stock with double potential.
Join now and get your risk free access by signing up here.
We head into the last week of May, with major global stock markets down in the neighborhood of 5% for the month. And with major global interest rates at the lowest levels since late 2016-2017.
With this in mind, let’s revisit how we opened the month of May.
On May 1, U.S. stocks had just put up the best opening four months since 1999. But the interest rate market was continuing signal that the Fed had made a mistake in its rate hiking campaign — specifically the December rate hike.
On a related note, we closed the first day of May with a sharp sell off in stocks, and we looked at this chart …
As you can see, the S&P 500 put in a big technial reversal signal — a bearish outside day.
With this technical setup, I said in my May 1 note: “you have to ask the question: Can stocks force the hand of the Fed, again?” … i.e. can a lower stock market force the Fed to cut rates — to take back the December mistake.
Here we are, twenty-seven days later, and stocks are down about 5%. That reversal signal did indeed predict the decline. But the decline hasn’t been messy like the slides of the fourth quarter. It has been orderly, and I suspect it’s not forcing the Fed’s hand.
But, what may force the Fed’s hand is the the bond market. Consider this, the last time U.S. 10-year government bond yield was at these levels, 2.25%, the Fed Funds rate was HALF of current levels (1.25% in Q3 of 2017 versus 2.5% today). This disconnect between what the market judges to be the appropriate interest rate and what the Fed judges the appropriate level, is causing the dreaded yield curve inversion signal that is scaring markets. If things stay here, that’s probably good enough for a June (19) rate cut.
If you haven’t signed up for my Billionaire’s Portfolio, don’t delay … we’ve just had another big exit in our portfolio, and we’ve replaced it with the favorite stock of the most revered investor in corporate America — it’s a stock with double potential.
Join now and get your risk free access by signing up here.
We’ve talked this week about the potential for a Plaza Accord 2.0.
As we discussed, the trade war has been manufactured by more than three-decades of China’s currency war. It only makes sense that it can only be resolved with a primary focus on the currency. We may find that if/when the U.S./China stalemate ends, it will be with a grand and coordinatedcurrency agreement.
Back in 1985, the U.S. was in a fight with Japan over the imbalance in trade. The Reagan administration ultimately brokered an agreement (the Plaza Accord) between the U.S., Japan, Germany, England and France. That resulted in a 50% devaluation of the dollar.
The China fight looks very similar.
With that in mind, we should keep a close eye on how currencies are trading. And today, things were moving.
Global rates were very heavy today. Stocks were heavy all day.
Generally, in the post-financial crisis world, that would mean a strongerdollar (i.e. a higher risk environment has tended to result in global money moving into the relative safety of dollars). That was the case as through Asia and Europe today with the dollar hitting the highs of the past twelve months. But when U.S. stocks opened, the dollar had a big reversal.
You can see in the chart above, the dollar index put in a bearish outside day (a key reversal signal) — something to keep an eye on for clues.
If you haven’t signed up for my Billionaire’s Portfolio, don’t delay … we’ve just had another big exit in our portfolio, and we’ve replaced it with the favorite stock of the most revered investor in corporate America — it’s a stock with double potential.
Join now and get your risk free access by signing up here.