May 9, 5:00 pm EST

Yesterday we talked about the tool China will use to offset tariffs, if a deal does not materialize and the tariff penalty increases.

They will devalue their currency.

With a “no deal” potential outcome, there’s a lot of wealth in China looking for ways out.

In recent years, they have found a way out through Bitcoin.  And, no coincidence, Bitcoin is again on the move.

With that, let’s take a look at the timeline on Bitcoin…

The 2016-2017 ascent of Bitcoin coincided perfectly with the crackdown on capital flight in China.  In late 2016, with rapid expansion of credit in China, growing non-performing loans, a soft economy and the prospects of a Trump administration that could put pressure on China trade, capital was moving aggressively out of China.

That’s when the government stepped UP capital controls — restricting movement of capital out of China, from transfers to foreign investment.

Of course, resourceful Chinese still found ways to move money.  Among them, buying Bitcoin. And that’s when Bitcoin started to really move (from sub-$1,000 to over $19,000). China cryptocurrency exchanges were said to account for 90% of global bitcoin trading.

Chinese capital flows were confused for Silicon Valley genius.

But in late 2017, China cracked down on Bitcoin – with a total ban.  A few months later, Bitcoin futures launched, which gave hedge funds a liquid way to short the madness. Bitcoin topped the day the futures contract launched.

So, as Chinese officials visit the White House for a deal or no deal on trade, China has been moving their currency lower — and bitcoin has (again) been moving higher.  Perhaps the Chinese are finding new ways to buy Bitcoin.

If you haven’t signed up for my Billionaire’s Portfolio, don’t delay … we’ve just had another big exit in our portfolio, and we’ve replaced it with the favorite stock of the most revered investor in corporate America — it’s a stock with double potential.

Join now and get your risk free access by signing up here.

May 3, 5:00 pm EST

If you are a regular reader of my daily notes, you’ll know we’ve been discussing the setup for positive surprises all year.

As we’re near the end of Q1 earnings season, clearly we’re getting it. With 78% of the companies in the S&P 500 now reported on Q1 earnings, 76% have beat earnings estimates.

And we’re getting positive surprises in the economic data.  We had a huge positive surprise for Q1 GDP this week.  And today we had a blow out jobs report.

There were 263k jobs added in April.  The market was expecting just 185k.  That gives us a 12-month average of 218k, well above pre-financial crisis average monthly job growth!  The unemployment number was 3.6% — the lowest since 1969.

Remember, we’ve been told all year long that we were headed for both earnings and economic recession.  It’s not happening.

Moreover, the two missing pieces of the economic recovery puzzle, have been productivity and wage growth.  And these pieces are emerging. Wage growth has been on the move for the past 18 months, now sustaining above 3%.   And we had a huge positive surprise in productivity this week.

With the above in mind, given the contrast of media narrative and reality, how are people getting it so wrong?   I suspect we are seeing plenty of people make the mistake of letting politics cloud their judgement on the economy and the outlook for stocks.

April 29, 5:00 pm EST

We ended last week with a positive surprise for Q1 GDP.  Today, we had more soft inflation data.

The Fed’s favored inflation gauge, core PCE, continues to fall away from it’s target of 2%.

Here’s a look at the chart …


With a Fed meeting this week, they remain in the sweet spot.  They have trend economic growth, subdued inflation and a 10-year yield at 2.5%.  They can sit and watch. They could cut!   That’s highly unlikely, but less unlikely by the summer, if current conditions persist.

The market is pricing in about a 60% chance that we’ll see a rate cut by year-end.  It doesn’t sound so crazy, if you consider that it would underpin/if not ensure the continuation of the economic expansion — perhaps even fueling an economic boom period.

Remember, we’ve talked about the 1994-1995 parallels. In 1994, an overly aggressive Fed raised rates into a recovering, low inflation economy.  By 1995, they were cutting.  That led to a 36% rise in stocks in 1995.  And it led to 4% growth in the economy through late 2000 — 18 consecutive quarters of 4%+ growth.  Stocks tripled over the five-year period.

This, as the S&P 500 is already sitting on new record highs?  As I said earlier this year, with yields back (well) under 3%, we should see multiples on stocks expand back toward 20x in this environment.

The forward 12-month P/E on the S&P 500 is currently 16.8.  If we multiply Wall Street’s earnings estimate on the S&P 500 ($175) times a P/E of 20, we get 3,500 in the S&P 500. That’s 19% higher than current levels.

But keep in mind, the earnings estimate bar has been set low.  And already 77% of companies are beating estimates on Q1 earnings.  I suspect, we’ll see higher earnings over the next twelve months than Wall Street has estimated, AND a higher multiple paid on those earnings (i.e. an outlook for an S&P 500 > 3,500).

If you haven’t signed up for my Billionaire’s Portfolio, don’t delay … we’ve just had another big exit in our portfolio, and we’ve replaced it with the favorite stock of the most revered investor in corporate America — it’s a stock with double potential.

Join now and get your risk free access by signing up here.

April 26, 5:00 pm EST

The first reading on first quarter U.S. GDP came in this morning at 3.2%— much better than expected.  This is a huge positive surprise, for what many expected to be a terrible quarter.

Just a month ago, the consensus view was something closer to 1%.  Goldman was looking for 0.7% going into the end of the quarter.

With that, we’ve been talking about this set-up for positive surprises all year.

Remember, the economy added on average 173,000 jobs a month in Q1.  Both manufacturing and services PMIs expanded in the quarter, and stocks fully recovered the losses from December.  Add to that, just days into the first quarter, the Fed told us they were done raising rates.  Whatever headwinds the Fed was stirring up, quickly became tailwinds.
Yet we’ve been told an economic recession was coming and an earnings recession upon us.  The above is a recipe for growth, not contraction.

Still, as we’ve discussed, never underestimate the appetite of Wall Street and corporate America to dial down expectations when given the opportunity.  That sets the table for positive surprises.  And positive surprises are fuel for stocks.   Stocks are fuel for confidence.  Confidence is fuel for the economy.

Last week we looked at the early signals on Q1 economic activity.  The positive surprises started with what looks like the bottom in Chinese industrial output and retail sales (two key indicators of economic health). This is important because the global slowdown fears have been centered around the weak Chinese economy.

Then both UK retail sales and the U.S. retail sales came in better.  And yesterday, we had a hot durable goods orders number in the U.S for March.

So, despite the negative picture that has been painted, the trajectory of U.S. economic growth seems to be well intact.

This is just the first reading on the Q1 number, but it gives us an average annualized growth rate of three percent even.  The average annualized growth coming out of the Great Recession (pre-Trumponomics) was just 2.2%.

And keep in mind, the next big pillar of Trumponomics is a trillion-dollar-plus infrastructure spend (with bipartisan support).

Just as expectations have been dialed down, this is where we could see a real economic boom kick in, especially if we get a deal on China (clearing that drag on sentiment).  As we’ve discussed, we are well overdue for an economic boom period.  We’ve yet to have the bounce-back in growth that is typical of a post-recession, if not post-depression environment.  You can see in the table below, the six years that followed the Great Depression, relative to the growth coming out of the Great Recession …


Have a great weekend!

If you haven’t signed up for my Billionaire’s Portfolio, don’t delay … we’ve just had another big exit in our portfolio, and we’ve replaced it with the favorite stock of the most revered investor in corporate America — it’s a stock with double potential.

Join now and get your risk free access by signing up here.

April 18, 5:00 pm EST

Yesterday we talked about the positive surprises in the Chinese data.  This is important because the global slowdown fears have been centered around the weak Chinese economy.

So, we now have what looks like a bounce off of the bottom in Chinese industrial output and Chinese retail sales (two key indicators of economic health).

Today we had more positive surprises for the global economic outlook picture.  The UK retail sales number came in better than expected.  And the U.S. retail sales came in better.

You can see in the chart below, this March U.S. retail sales is a bounce from the post-crisis lows of December.  

With this, the Q1 GDP estimate from the Atlanta Fed has bumped up to 2.8%.

We’ve talked about the set up for both earnings and the economic data to surprise to the upside for Q1, given the dialed down expectations following the December decline in stocks.

You can see how this is playing out in the chart below (see where the gold line is diverging from the “consensus estimate” blue line) …

If you haven’t signed up for my Billionaire’s Portfolio, don’t delay … we’ve just had another big exit in our portfolio, and we’ve replaced it with the favorite stock of the most revered investor in corporate America — it’s a stock with double potential.

Join now and get your risk free access by signing up here.

April 17, 5:00 pm EST

Last month we talked about Chinese stocks has a key spot to watch for: 1) are they doing enough to stimulate the struggling economy, and 2) (more importantly) are they taking serious steps to get to an agreement on trade with the U.S.?

The signal has been good.  Chinese stocks are up 34% since January 4th.

As I said back in March, Chinese stocks are reflecting optimism that a bottom is in for the trade war and for Chinese economic fragility.  That’s a big signal for the global (and U.S.) economy.

Fast forward a month, and we’re starting to see it (the bottoming) in the Chinese data.  Overnight, we had a better than expected GDP report.  And industrial output in China climbed at the hottest rate since 2014.

For those that question the integrity of the Chinese GDP data, many will look at industrial output and retail sales.  Retail sales had a better than expected number too overnight.  And the chart (too) looks like a bottom is in. 

Remember, by the end of last year, much of the economic data in China was running at or worse than 2009 levels (the depths of the global economic crisis).

The signal in stocks turned on the day that the Fed put an end to its rate hiking path AND when the U.S. and China re-opened trade talks (both on January 4th).

April 16, 5:00 pm EST

With Bank of America earnings this morning, we’ve now heard from the big four banks (JPM, BAC, WFC and C).

The expectations were set for just 2% earnings yoy earnings growth from the group.  We’ve had positive earnings surprises in each, for an average earnings growth of 11%.  That’s double-digit earnings growth for the biggest banks in the country, in an earnings season that has been forewarned as an “earnings recession.”

Remember, never underestimate the appetite for Wall Street and corporate America to dial down expectations when given the opportunity.  They’ve done it, and we’re seeing positive surprises.

Now, we’ve talked about the slate IPOs coming from the Silicon Valley hype machine.  As I’ve said, Lyft and Uber, dumping shares on the public at a combined $140 billion plus valuation, may mark the end to the Silicon Valley boom cycle.

As we know, Lyft was valued as high as $25 billion when it started trading publicly.  Some paid a $25 billion valuation for the privilege of owning a company that did a little over $2 billion in revenue, while losing almost a billion dollars — with slowing revenue growth and widening losses. It has now shed about $9 billion in market cap in thirteen days.

Uber is on deck.  Uber filed its S-1 this week.  In this public disclosure document, we find a company that has privately raised $24 billion, valued at $68 billion in the private market, that has been thought to float shares at as much as $120 billion valuation.  This is a company that (like Lyft) also with slowing revenue growth and widening losses.  Losses?  The S-1 shows a swing from $ 4 billion loss in 2017, to a near $1 billion profit in 2018.  But if we back out the a couple of unusual items (like the gain of a divestiture of some foreign businesses and an unrealized gain in an “investment”) the company lost $4.2 billion on $11 billion in revenue.

As we discussed last month, the hyper-growth valuations on these perceived hyper-growth companies, are unlikely to get hyper-growth at this stage.  That will be a problem for those taking the bait on the IPO.

If you haven’t signed up for my Billionaire’s Portfolio, don’t delay … we’ve just had another big exit in our portfolio, and we’ve replaced it with the favorite stock of the most revered investor in corporate America — it’s a stock with double potential.

Join now and get your risk free access by signing up here.

April 15, 5:00 pm EST

As we discussed last week, the table has been set (again) for positive earnings surprises.  And we’ll see more this week, as Q1 earnings kick into gear.

The tone has already been set, with the big surprises reported on Friday from two of the four biggest banks.  The market was looking for earnings contraction from JP Morgan and Wells Fargo. Instead, we had 7% yoy growth from JPM, and 12% yoy growth from Wells.

Today we heard from Citi, the third largest bank in the country.  Citi beat expectations with 11% earnings growth in the first quarter, compared to the same period a year ago.  And tomorrow we’ll hear from Bank of America, the second largest bank in the country.

So far, Jeff Ubben has been spot on about the banks.  Ubben is the founder of ValueAct Partners, one of the best activist investors in the business over the past twenty years.  Remember, back in January, as we were stepping through positive surprises in bank earnings from the fourth quarter, we talked about Ubben’s thoughts on banks.  He has said that the U.S. banking system has the lowest risk profile “than any time in our investing lifetime.”

In our Billionaire’s Portfolio, we followed him into Citigroup, the highest conviction position in his $16 billion portfolio.  Citi is the cheapest of the four biggest U.S.-based global money center banks — still trading at a 30% discount to peak pre-crisis market value, despite being far better capitalized, better regulated and a more efficient business than it was in the pre-financial crisis days. With that, not coincidentally, as the banks have beaten expectations, Citi has been the best performing big bank year-to-date (up 29%).

If you haven’t signed up for my Billionaire’s Portfolio, don’t delay … we’ve just had another big exit in our portfolio, and we’ve replaced it with the favorite stock of the most revered investor in corporate America — it’s a stock with double potential.

Join now and get your risk free access by signing up here.

April 9, 5:00 pm EST

A key piece in the continuation of the global economic recovery will be a weaker dollar.  It will drive a more balanced U.S. and global economy, and it will reflect strength in emerging markets (i.e. capital flows to emerging markets).

To this point, as we’ve discussed, higher U.S. rates have meant a stronger dollar.  With global central banks moving in opposite directions in recent years, capital has flowed to the United States.  But the emerging markets have suffered under this dynamic.  As money has moved OUT of emerging market economies, their economies have weakened, their currencies have weakened, and their foreign currency denominated debt has increased.

But now we have a retrenchment from the Fed.  And we have coordinated global monetary policy (facing in the same direction).

This sets up to solidify a long-term bear market for the dollar.

Let’s take a look at a couple of charts that argue the long-term trend is already lower, and the next leg will be much lower.

First, here’s a revisit of the long-term dollar cycles, which we’ve looked at quite a bit in this daily note.

Since the failure of the Bretton-Woods system, the dollar has traded in six distinct cycles – spanning 7.6 years on average.  Based on the performance and duration of past cycles, the bull cycle is over, and the bear cycle is more than two years in.

With this in mind, if we look within this current bear cycle, technically the dollar is trading into a major resistance area – a 61.8% retracement.  The next leg should be lower, and for a long period of time. 

Trump wants a weaker dollar, and I suspect he’s going to get it.

Sign up to my Billionaire’s Portfolio and get my market beating Billionaires Portfolio … Live Portfolio Review conference calls … Weekly notes with updates and specific recommendations on following the best billionaire investors …  Access to my member’s only area on the Billionaire’s Portfolio.  Plus, my blog — full of information that will set you apart from other average investors.

Join now and get your risk free access by signing up here.

April 8, 5:00 pm EST

As we discussed on Friday, the overhang of risks to markets, to the Trump administration and to the economy are as light as we’ve seen in quite some time.

With this in mind, we have a fairly light data week – which means the likelihood of a disruption in the rise in stocks and risk appetite remains low.

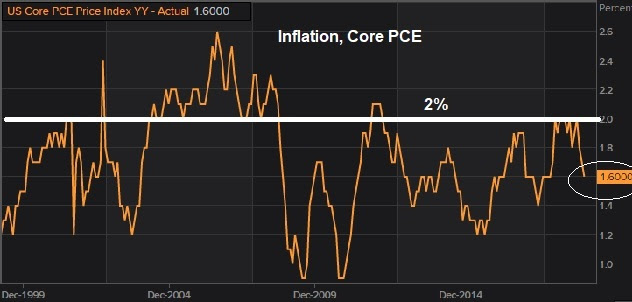
We get some inflation data this week, which should be tame, justifying the central bank dovishness we’ve seen in recent months.  The ECB meets this week.  They’ve already walked back on the idea that they might hike rates this year.  Expect Draghi to hold the line on that.  The Chinese negotiations have positive momentum, with reports over the weekend that talks last week advanced the ball.  And we have another week before Q1 earnings season kicks in.

So, expect the upward momentum to continue for stocks.  Just three months into the year and stocks are up big, and back near record highs in the U.S..  The S&P 500 is up 15% year-to-date.  The DJIA is up 13%.  Nasdaq is up 20%.  German stocks are up 13%.  Japanese stocks are up 11%.  And Chinese stocks are up 32%.

Remember, we’ve talked about the signal Chinese stocks might be giving us, putting in a low on the day the Fed did it’s about face on the rate path, back on January 4th.

The aggressive bounce we’ve since had in Chinese stocks appears to be telegraphing the bottoming in the Chinese economy   That’s a big relief signal for the global economy.  Commodities prices are supporting that view (sending the same signal).  Oil is now up 42% on the year.  And the CRB industrial metals index is up 24%.

Sign up to my Billionaire’s Portfolio and get my market beating Billionaires Portfolio … Live Portfolio Review conference calls … Weekly notes with updates and specific recommendations on following the best billionaire investors …  Access to my member’s only area on the Billionaire’s Portfolio.  Plus, my blog — full of information that will set you apart from other average investors.

Join now and get your risk free access by signing up here.